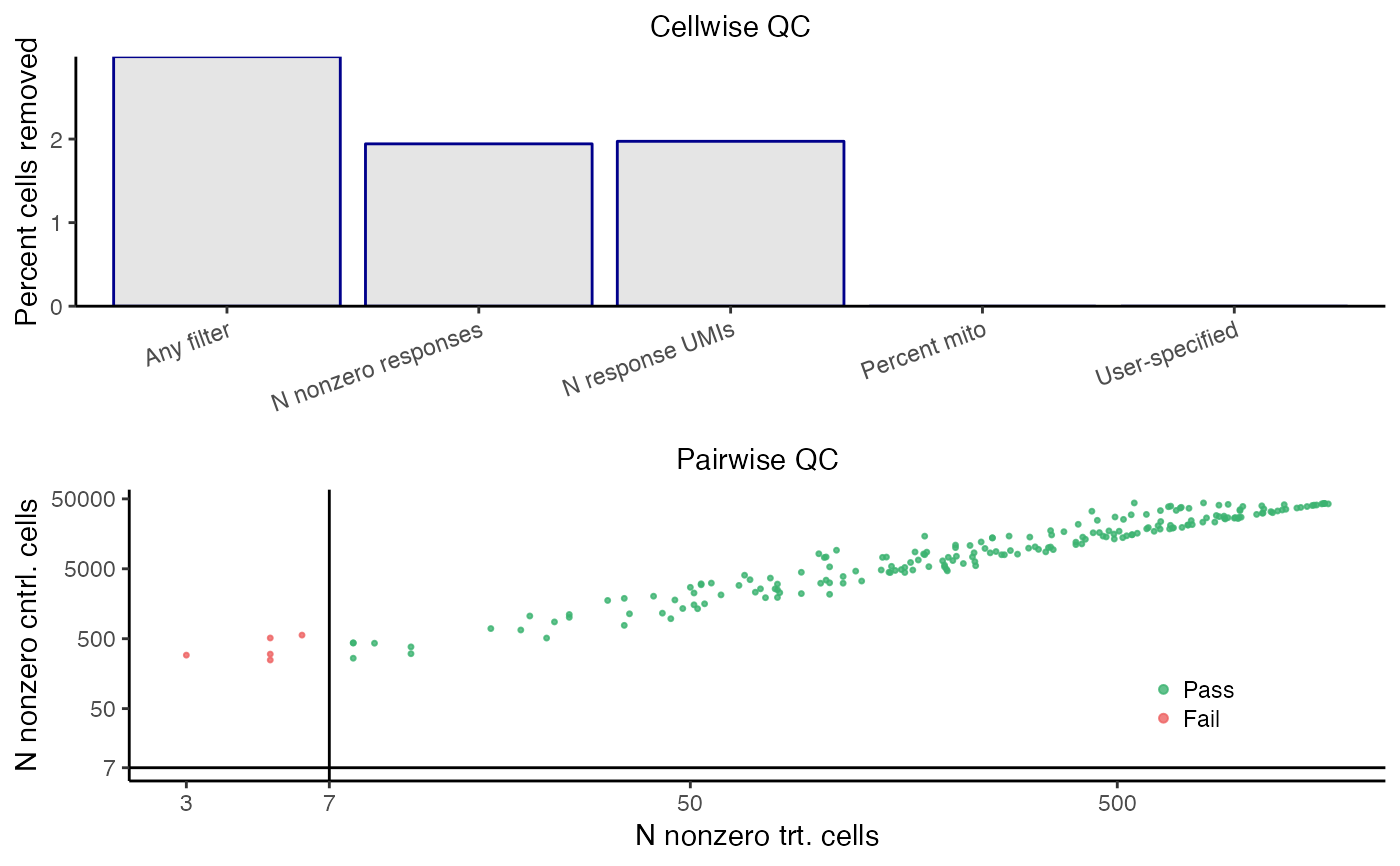
plot_run_qc() creates a visualization of the outcome of the QC step. The
top panel depicts the outcome of the cellwise QC. The various cellwise QC
filters (e.g., "N nonzero responses," "N response UMIs," "Percent mito",
etc.) are shown on the horizontal axis, and the percentage of cells removed
due application of a given QC filter is shown on the vertical axis. Note that
a cell can be flagged by multiple QC filters; for example, a cell might have
an extremely high response_n_umi value and an extremely high
response_n_nonzero value. Thus, the height of the "any filter" bar (which
indicates the percentage of cells removed due to application of any filter)
need not be equal to the sum of the heights of the other bars. The bottom
panel depicts the outcome of the pairwise QC. Each point corresponds to a
target-response pair; the vertical axis (resp., horizontal axis) indicates
the n_nonzero_trt (resp., n_nonzero_cntrl) value of that pair. Pairs for
which n_nonzero_trt or n_nonzero_cntrl fall below the threshold are
removed (red), while the remaining pairs are retained (green).
Usage
plot_run_qc(
  sceptre_object,
  downsample_pairs = 10000L,
  point_size = 0.55,
  transparency = 0.8,
  return_indiv_plots = FALSE
)
Arguments
- sceptre_object
a
sceptre_objectthat has hadrun_qc()called on it- downsample_pairs
(optional; default
10000) the maximum number of points to plot in the lower panel of the figure (i.e., the "pairwise QC" plot)- point_size
(optional; default
0.55) the size of the individual points in the plot- transparency
(optional; default
0.8) the transparency of the individual points in the plot- return_indiv_plots
(optional; default
FALSE) ifFALSEthen a list ofggplotis returned; ifTRUEthen a singlecowplotobject is returned.
Value
a single cowplot object containing the combined panels (if
return_indiv_plots is set to TRUE) or a list of the individual
panels (if return_indiv_plots is set to FALSE)
Examples
data(highmoi_example_data)
data(grna_target_data_frame_highmoi)
# import data
sceptre_object <- import_data(
  response_matrix = highmoi_example_data$response_matrix,
  grna_matrix = highmoi_example_data$grna_matrix,
  grna_target_data_frame = grna_target_data_frame_highmoi,
  moi = "high",
  extra_covariates = highmoi_example_data$extra_covariates,
  response_names = highmoi_example_data$gene_names
)
discovery_pairs <- construct_cis_pairs(sceptre_object)
sceptre_object |>
  set_analysis_parameters(
    discovery_pairs = discovery_pairs,
    side = "left"
  ) |>
  assign_grnas(method = "thresholding") |>
  run_qc() |>
  plot_run_qc()