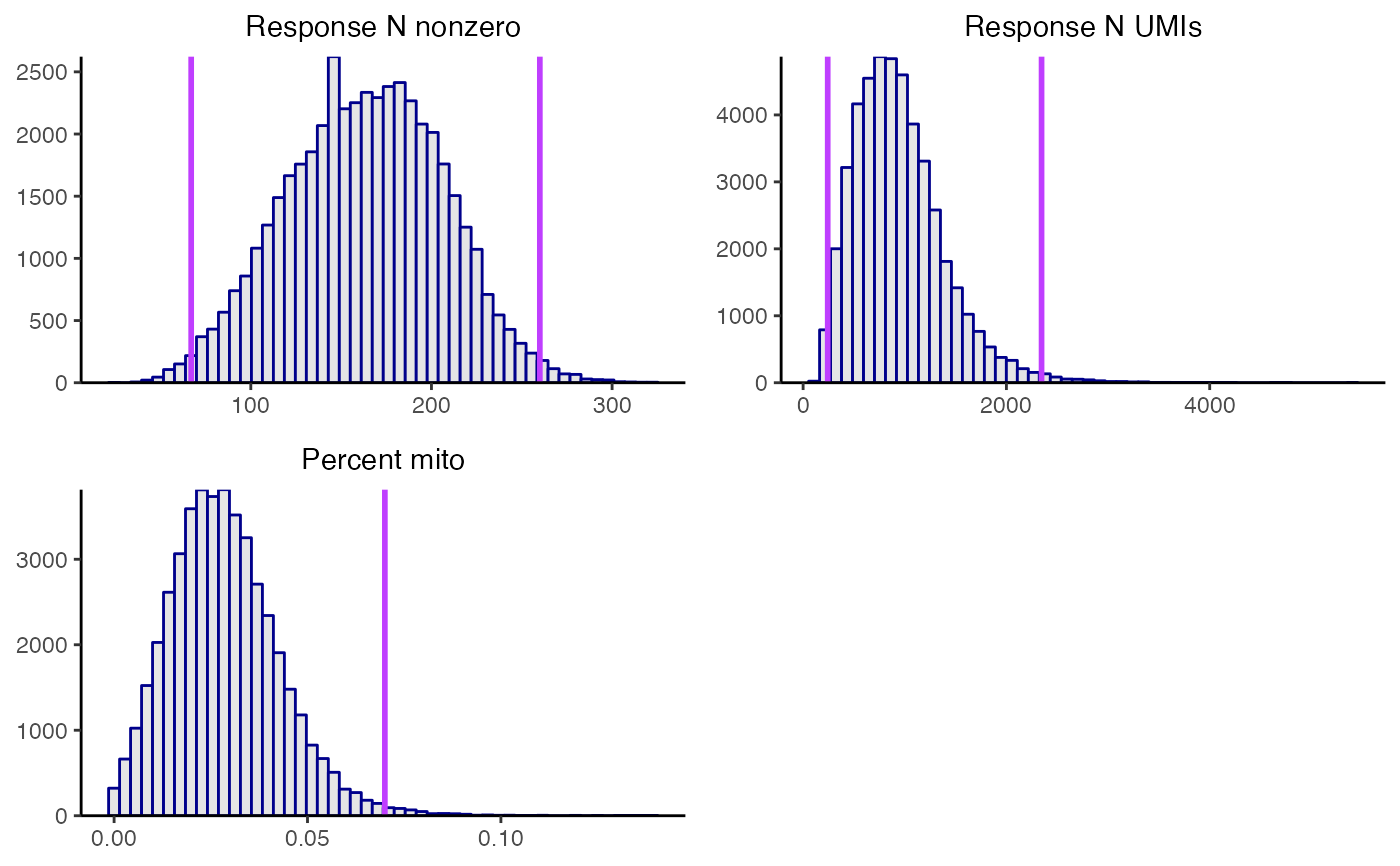
plot_covariates() creates a histogram of the covariates
response_n_nonzero, response_n_umis, and (if applicable)
response_p_mito. Cellwise QC removes cells that lie in the extreme right
tail of the response_p_mito distribution or that lie in the extreme left
or right tail of the response_n_nonzero or response_n_umis
distribution. To help guide the selection of QC thresholds,
plot_covariates() plots candidate QC thresholds as vertical lines on the
histograms. The optional arguments response_n_nonzero_range,
response_n_umis_range, and p_mito_threshold control the location of these
candidate QC thresholds. response_n_nonzero_range (resp.,
response_n_umis_range) is a length-two vector of quantiles (default:
c(0.01, 0.99)) indicating the location at which to draw candidate QC
thresholds on the response_n_nonzero (resp., response_n_umis) histogram.
Next, p_mito_threshold is a single numeric value in the interval [0,1]
specifying the location at which to draw a candidate QC threshold on the
response_p_mito plot.
Arguments
- sceptre_object
a
sceptre_object- response_n_umis_range
(optional; default
c(0.01, 0.99)) a length-2 vector of quantiles indicating the location at which to draw vertical lines on theresponse_n_umishistogram- response_n_nonzero_range
(optional; default
c(0.01, 0.99)) a length-2 vector of quantiles indicating the location at which to draw vertical lines on theresponse_n_nonzerohistogram- p_mito_threshold
(optional; default
0.2) a single numeric value in the interval [0,1] specifying the location at which to draw a vertical line on theresponse_p_mitohistogram. Note thatp_mito_thresholdis an absolute number rather than a percentile.- return_indiv_plots
(optional; default
FALSE) ifFALSE, then a list ofggplotobjects is returned; ifTRUEthen a singlecowplotobject is returned.
Value
a single cowplot object containing the combined panels (if
return_indiv_plots is set to TRUE) or a list of the individual
panels (if return_indiv_plots is set to FALSE)
Note
If run_qc() has already been called on the sceptre_object, then the
parameters response_n_umis_range, response_n_nonzero_range, and
p_mito_threshold are set to the corresponding parameters within the
sceptre_object.
Examples
data(highmoi_example_data)
data(grna_target_data_frame_highmoi)
import_data(
  response_matrix = highmoi_example_data$response_matrix,
  grna_matrix = highmoi_example_data$grna_matrix,
  grna_target_data_frame = grna_target_data_frame_highmoi,
  moi = "high",
  extra_covariates = highmoi_example_data$extra_covariates,
  response_names = highmoi_example_data$gene_names
) |> plot_covariates(p_mito_threshold = 0.07)